Journal: bioRxiv
Article Title: The serine-threonine kinase TAO3 promotes cancer invasion and tumor growth by facilitating trafficking of endosomes containing the invadopodia scaffold TKS5α
doi: 10.1101/2020.02.27.968305
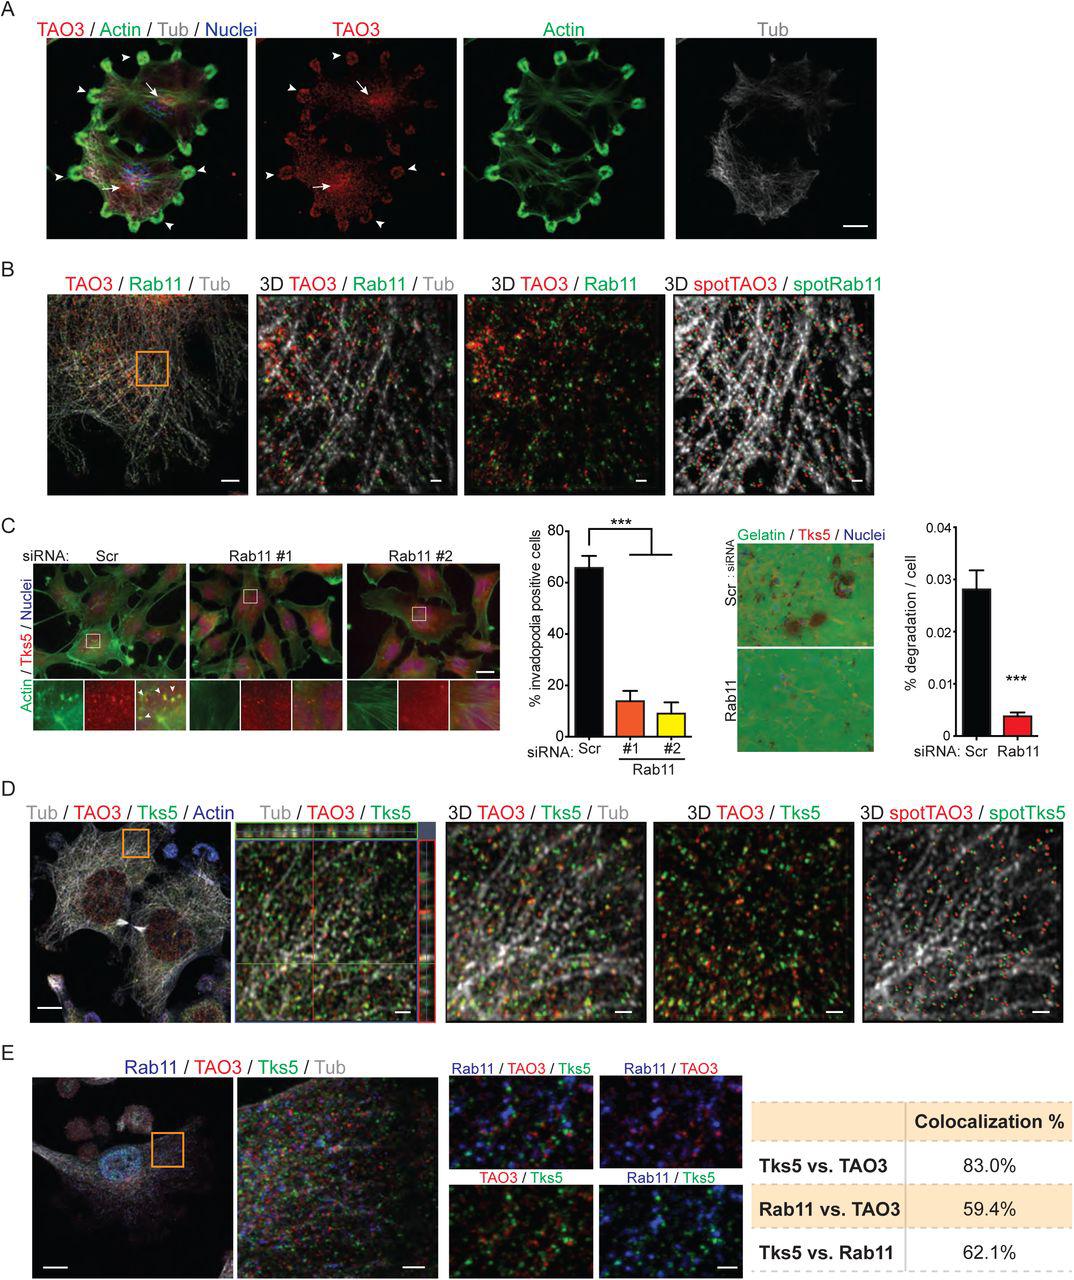
Figure Lengend Snippet: A Distribution of TAO3. Staining of TAO3 (red), actin (green), tubulin (gray) and nuclei (blue in merged image only) in Src3T3 cells. Images were processed by maximum intensity projection. Arrowheads indicate invadopodial positioning of TAO3. Arrows indicate endosomal positioning of TAO3. B Colocalization of TAO3 and RAB11. Staining of TAO3 (red), RAB11 (green) and tubulin (gray) in Src3T3 cells. Images were processed by maximum intensity projection (left) and 3D reconstruction using Imaris software (3D, magnified area from orange square in left image). Colocalized TAO3 and RAB11 were spotted and shown with tubulin (3D spot, right). C Invadopodia formation (left) and gelatin degradation (right) analysis in C8161.9 cells with siRNA-scrambled and –RAB11. Two individual siRNA-RAB11 (#1 and #2) were used for invadopodia assay. Pool-siRNA-RAB11 (four siRNAs) was used for degradation assay. Representative images (left) and percentage of invadopodia positive cells or percentage of degradation per cells (right). Immunofluorescence staining of invadopodia by actin (phalloidin, green) and TKS5 (red), and Hoechst to denote nuclei of cells. Arrowheads indicate TKS5+ invadopodia. D Colocalization of TAO3 and TKS5 α . Staining of tubulin (gray), TAO3 (red), TKS5 α (green) and actin (blue) in Src3T3 cells. Images were processed by maximum intensity projection (left). Magnified area (orange square in left) was shown as orthogonal view (second left) and 3D reconstruction by Imaris software (3D). Colocalized TAO3 and TKS5 α were spotted and shown with tubulin (3D spot, right). E Colocalization of RAB11, TAO3 and TKS5 α . Staining of tubulin (gray), RAB11 (blue), TAO3 (red) and TKS5 α (green) in Src3T3 cells. Images were processed by maximum intensity projection (left). Magnified area (orange square in left) shown (second left, single plane z-stack image) and higher magnification images are shown in small four panels with different combination of channels. Colocalization between each RAB11, TAO3 and TKS5 α was analyzed by Imaris software and shown in table (right). Scale bars, 10 μm (A, B left, D left and E left), 1 μm (B and D right three), 2 μm (E second left) and 20 μm (C). Data shown in panel C is n=6 to 7 in each experimental group and were validated in two separate experiments. P >0.05 unless other specified; ***, P <0.001.
Article Snippet: Plasmids encoding wild-type human RAB11 (#12679) was obtained from Addgene.
Techniques: Staining, Software, Invadopodia Assay, Degradation Assay, Immunofluorescence